-
About the Air District
- Board of Directors
- Advisory Council
- Job Opportunities
- Mission Statement
- History of Air District
- Departments
- Diversity Equity and Inclusion
- Air District Leadership
- Hearing Board
- Community Advisory Council
- Bay Area Clean Air Foundation
- Request for Proposals (RFP RFQ)
- In Your Community
- Speakers and Tours
- News & Events
- Online Services
- Publications
- Forms
- Public Records
- Contact Us
- Login
|
|
|
Rules and Compliance
Rules & Compliance
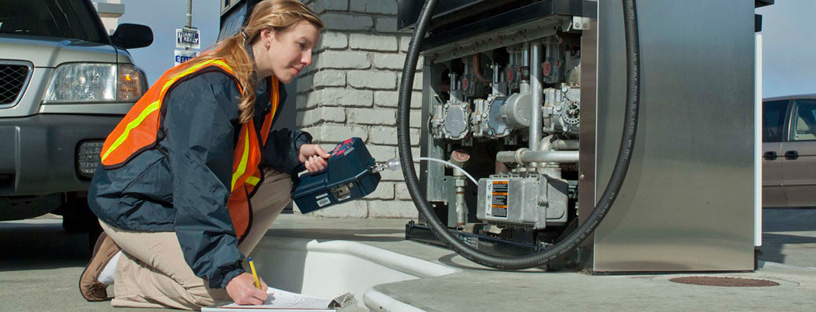
Learn about Air District Rules, how to comply with them, how our inspection process makes sure they are followed and what new rules we are working on.
The Air Quality District develops regulations based on the measures identified in its Clean Air Plan. Air District staff develop new rules to reduce emissions in order to improve public health, air quality and the global climate.
Rule Development is the process Air District staff uses to write regulations that govern stationary sources of air pollution in the Bay Area. It involves technical research, engagement with affected stakeholders, public meetings to allow input by affected parties such as industries and communities, and the preparation of CEQA and socio economic analyses.
As new rules are adopted by a vote of the Air District’s Board of Directors and are then enforced via Air District Permit and Inspections programs.
Contact Us
Compliance & Enforcement
Compliance Assistance
415.749.4999 compliance@baaqmd.gov
Rule Development
415.749.4653 ruledevelopment@baaqmd.gov
Last Updated: 1/6/2022