|
|
Assessment and Research
Learn about emission research studies in the Bay Area that contribute to an improved understanding of emissions inventories.
On occasion, the Air District conducts short-term emissions studies in the San Francisco Bay Area to:
- Improve the accuracy of emissions estimates of certain source categories,
- Assess the benefits of emissions reduction measures, and
- Produce emissions for local-scale air pollution assessments
View information about recent emissions studies below.
The Air District mobile sampling van is used to sample truck plumes from trucks traveling on a major arterial road enroute to the Port of Oakland (2015).
Drayage Truck Study at the Port of Oakland
The Air District partnered with UC Berkeley and the Lawrence Berkeley National Laboratory to measure diesel particulate matter (DPM), black carbon (BC), and nitrogen oxide (NOx) emissions from drayage trucks before, during, and after implementation of the California Air Resources Board’s Drayage Truck Regulation. This regulation required drayage trucks to adopt diesel particle filters (DPFs) and selective catalytic reduction (SCR) systems for controlling tailpipe emissions of DPM and NOx. Drayage trucks are those that transport goods to and from freight-handling facilities—including those located within and around environmental justice communities—and historically have been the oldest trucks with higher emission rates than longer-haul trucks.
During a set of monitoring campaigns from 2009 to 2015, researchers documented significant emissions reductions from trucks serving the Port of Oakland. During this period, the fraction of trucks equipped with a DPF at the Port of Oakland increased from 2 to 99 percent, the fraction with SCR systems increased from 0 to 25 percent, and the median engine age decreased from 11 to 7 years. Because of the rapid adoption of these emission control technologies and modernization of the drayage fleet, the average emission rates for both BC and NOx decreased by ~70 percent.
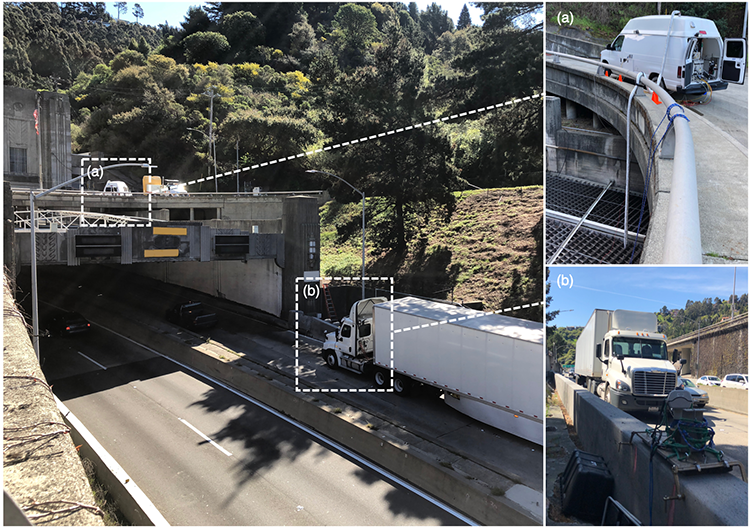
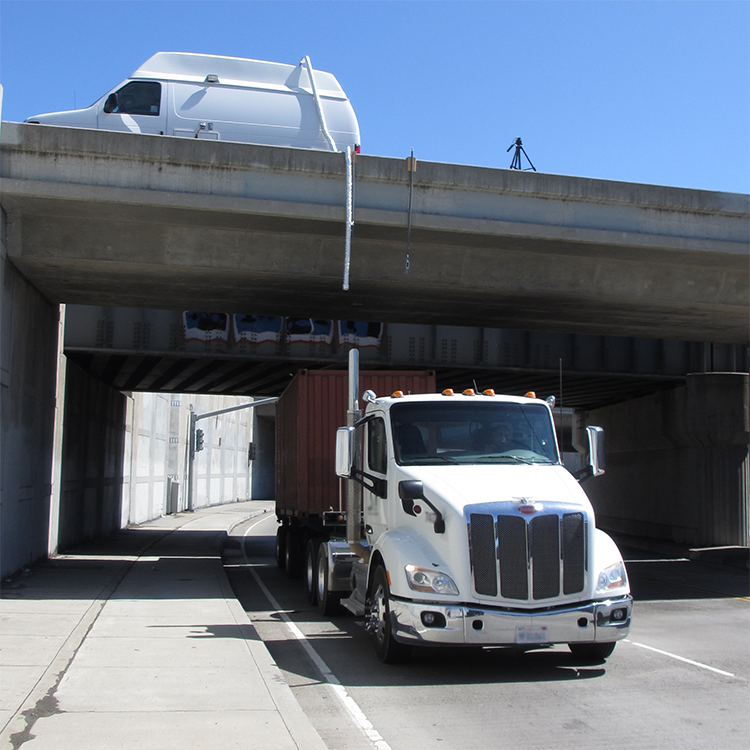
The Air District mobile sampling van is used to sample truck plumes from above the west entrance to the Caldecott Tunnel (2014).
Caldecott Tunnel Truck Study
The Air District supported a multi-year California Air Resources Board study at a highway site along Caldecott Tunnel to measure the emissions benefits of CARB’s Truck and Bus Regulation. Like the Drayage Truck Regulation described above, this regulation required the rapid modernization of the on-road heavy-duty diesel truck fleet and accelerated adoption of DPFs and SCR systems by all trucks and buses operating in the state of California.
Between 2014 and 2021, researchers from the University of California, Berkeley, and Lawrence Berkeley National Laboratory used the Air District’s mobile sampling van to measure tailpipe emissions from thousands of in-use heavy-duty trucks as the Truck and Bus Regulation was phased-in. Compared to the pre-regulation fleet measured in 2010, the fraction of on-road trucks equipped with DPFs increased from 15 percent in 2010 to 99 percent in 2021 and the fraction equipped with SCR increased from 2 to 87 percent. As a result, fleet-average emission rates decreased by ~80 percent for both BC and NOx.
Initial study results were published in Environmental Science & Technology in 2018 and 2019.
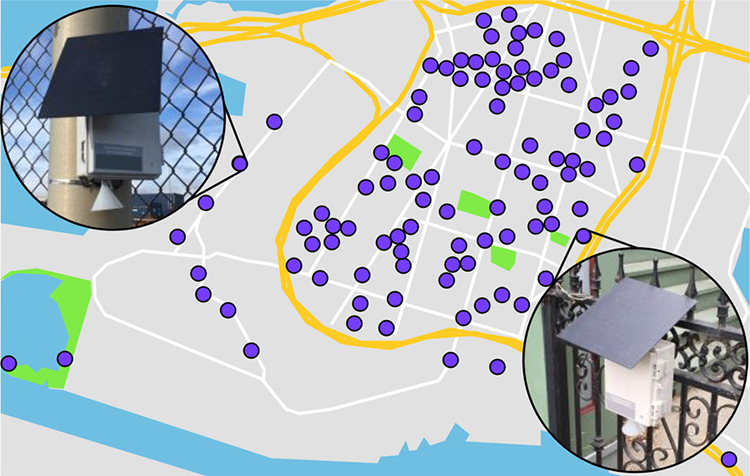
A network of 100 BC sensors were deployed for 100 days in the summer of 2017 across the community of West Oakland.
West Oakland 100 by 100 Black Carbon Network Study
The West Oakland Community Air Quality Study that deployed a network of 100 black carbon sensors for 100 days in the summer of 2017 was enabled by a partnership between key stakeholders and researchers from the University of California, Berkeley, and Berkeley Lab, including the environmental justice advocacy organization West Oakland Environmental Indicators Project (WOEIP), the Environmental Defense Fund (EDF), the Port of Oakland, and the Air District. WOEIP, EDF, and the Berkeley researchers collectively recruited residential and commercial hosts of the BC sensors. Additional monitoring locations were made accessible by the Port of Oakland and the Air District.
Through this collaboration, this study built the densest network of black carbon sensors in a single city and supported the goals of the various partners. For example, the community group received actionable data that has enabled them to advocate in the decision-making process for new policies to mitigate air pollution, including those associated with California's Community Air Protection Program (Assembly Bill 617). Strong BC concentration fluctuations were periodically observed over diurnal and weekly cycles, reflecting the impact of localized traffic emissions and industrial facilities in the neighborhood. Overall, the results demonstrate how distributed sensor networks can reveal the complex spatiotemporal dynamics of combustion-related air pollution within urban neighborhoods.
The study is described in detail in a peer-reviewed paper published in Environmental Science & Technology.
Methane Airborne Emissions Quantification Study
In a follow-up to a few top-down emissions assessment studies that indicated significant underestimation of methane emissions in bottom-up inventories in the San Francisco Bay Area, the Air District conducted a 3-year long campaign to determine facility-level methane emission rates.
An airborne mass balance technique was applied from a low-flying aircraft to derive methane emission rates from 92 airborne observations collected over 23 facilities, including 5 refineries, 10 landfills, 4 wastewater treatment plants (POTWs), 2 composting operations, and 2 dairies. Annual measurement-based sector-wide methane emissions were determined from these emission rates and compared to bottom-up and facility-reported estimates. The measured emissions for San Francisco Bay Area refineries ranged from 4 to 23 times larger than the corresponding inventory estimates (see figure below), while measurement-derived landfill and POTW estimates were approximately twice the current inventory estimates. Complementary evidence from airborne remote sensing imagery over the San Francisco Bay Area indicated that atmospheric venting from refinery hydrogen plants, landfill working surfaces, composting stockpiles, etc., was among the specific source types responsible for the observed discrepancies.
This study highlights the value of multi-tier measurement approaches to accurately estimating facility-scale methane emissions and performing source attribution at sub-facility scales to guide and verify effective climate mitigation policy and action.
- 800
- 600
- 400
- 200
- 0
-
Refinery 1
-
Refinery 2
-
Refinery 3
-
Refinery 4
-
Refinery 5
-
USAEPA reported (2015-17)
-
BAAQMD reported (2016-17)
-
CARB reported (2015-16)
-
Sci. Av. flights (2015-18)
Comparison of airborne measurement-based estimates of methane from Bay Area’s five refineries with bottom-up estimates reported to various agencies.
Last Updated: 8/18/2023